Demos
|
Global IP Estimator – Portfolio
Getting to Know Global IP Estimator – Portfolio
Want to see Global IP Estimator – Portfolio in action? It only takes a few minutes to see how you can save hours of time, thousands of dollars, and plenty of headaches down the road!
Get to know Global IP Estimator – Portfolio, Anaqua's innovative and easy-to-use global estimating software for managing your IP portfolio, by watching a demo or viewing/downloading
sample patent portfolio analysis reports below.


Contact us for a demo

View Sample Reports
Explore the variety of patent portfolio analysis reports the Global IP Estimator – Portfolio tool can create for you. These reports are listed from most summarized, good for quick IP management review, to most detailed, which shows you all of the costs that are included.
**These examples are for illustration purposes only and are based on a small portfolio containing only a few patents, therefore the figures are not large. For larger portfolios, the figures would be scaled accordingly.
Analysis by Patent Grouping and Country
Analysis by Patent Family and Country
The following analysis reports show the selected patent families analyzed by country and a yearly timeframe. In your customized analysis you will be able to specify the timeframe to be yearly, quarterly or monthly.
Download these sample reports.
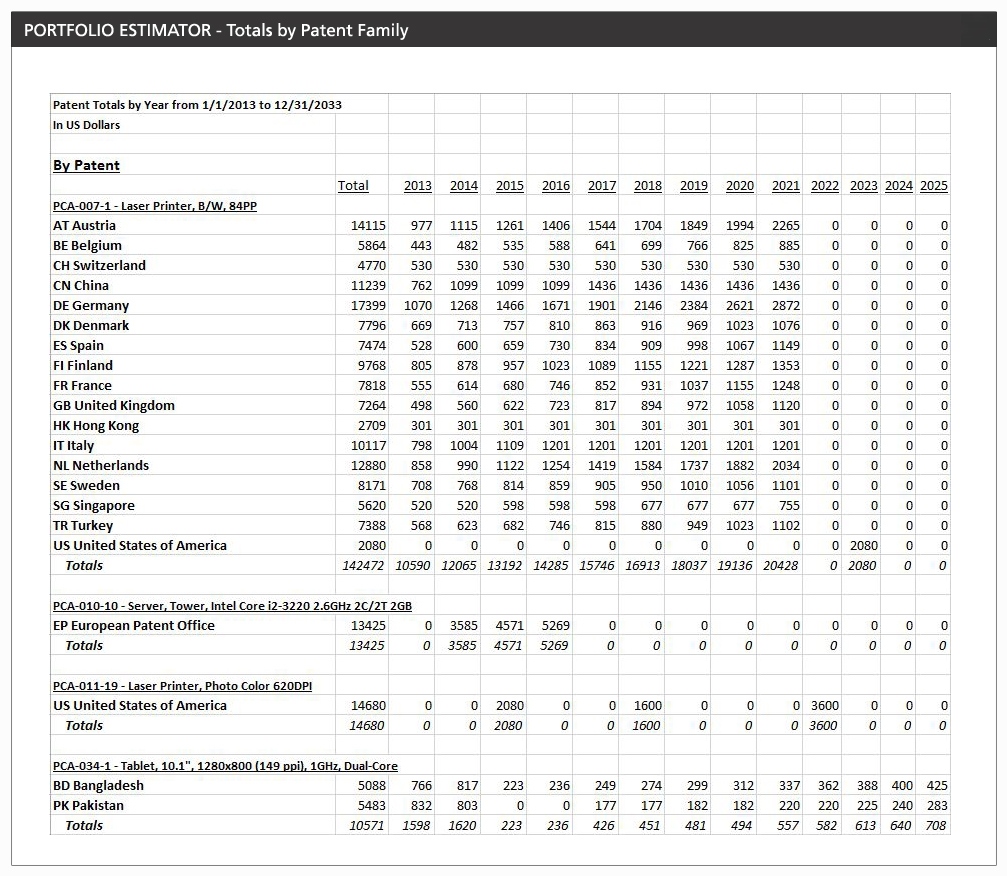
- Totals by Patent family
Spreadsheet of totals for each patent family by country for each year
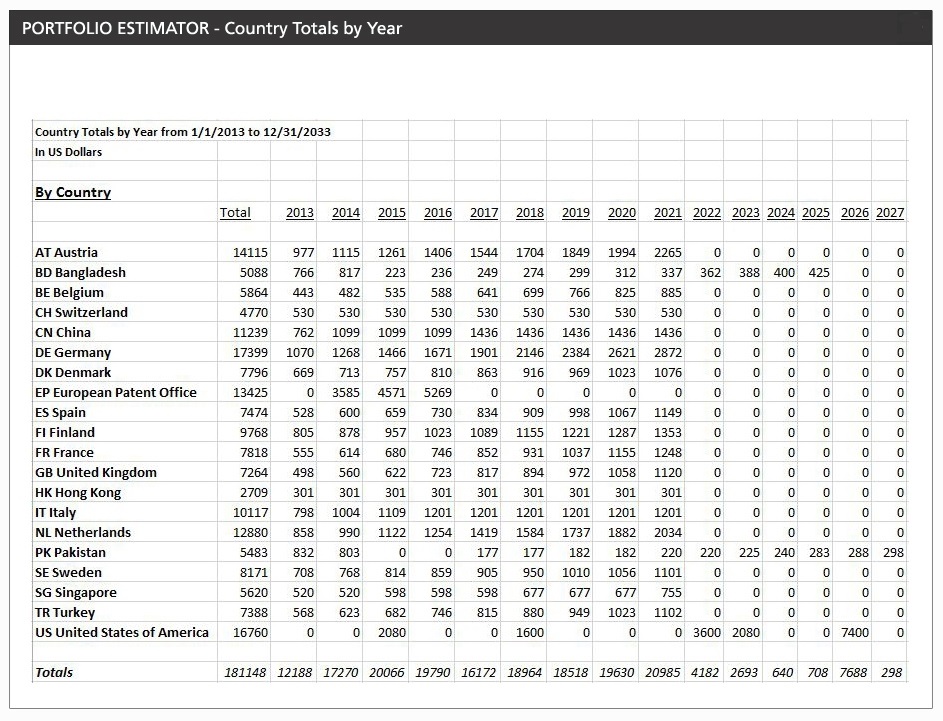
- Country Totals
Spreadsheet of all selected patent families totaled by country for each year
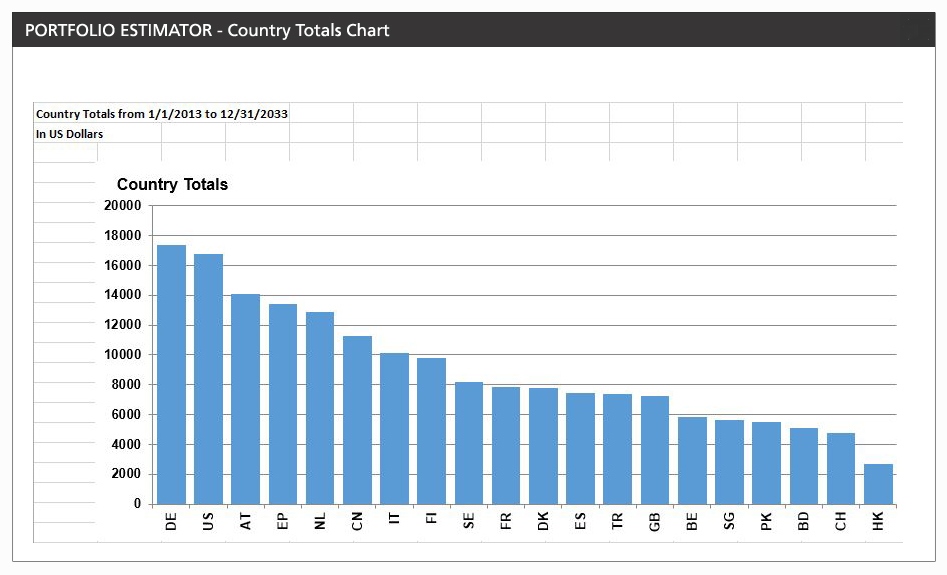
- Country Totals Chart
Patent family totals by country for each year, displayed in a bar chart
Hide
Individual Patent Family Totals
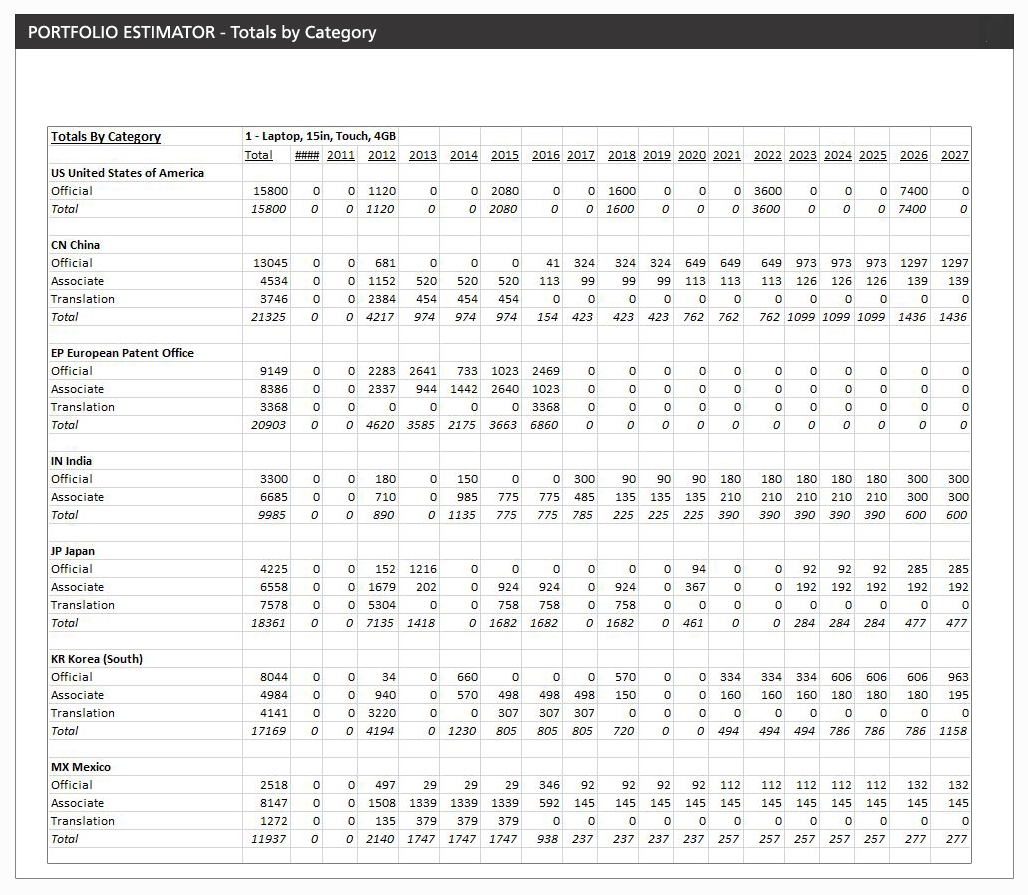
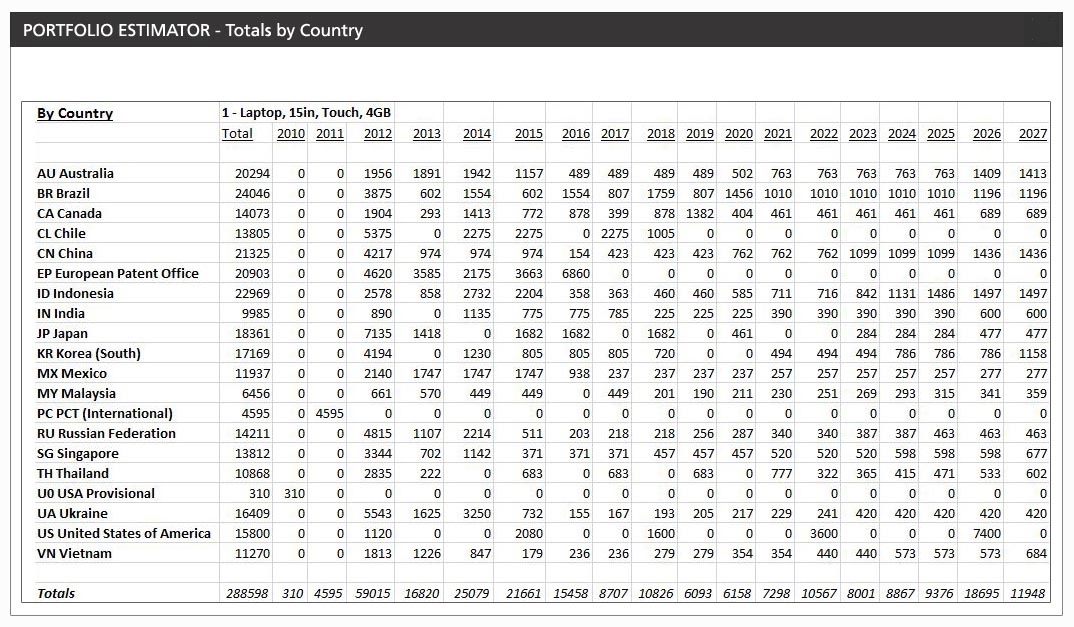
The following examples show a single analysis report made up of four sections (sheets): Totals by Stage, Totals by Category, Totals by Country, and Running Totals by Country. The yearly analysis was conducted for the life of a selected patent family and is presented in an Excel® spreadsheet. In your customized analysis you will be able to specify the timeframe to be yearly, quarterly or monthly.
Download these sample reports.
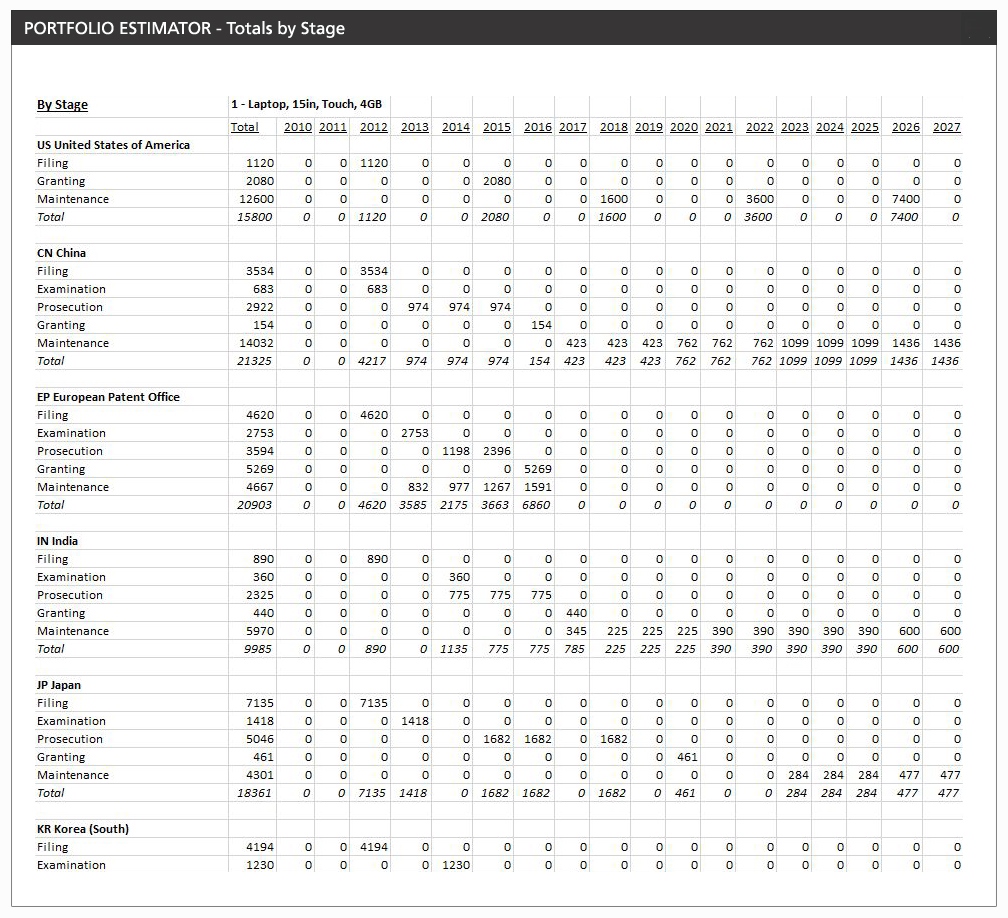
- Totals by Stage
Spreadsheet of totals by stage, broken down by each country, for each year
- Totals by Category
Spreadsheet of totals by category, broken down by each country, for each year
- Totals by Country
Spreadsheet of totals by country for each year
Hide
Individual Family Details by Country
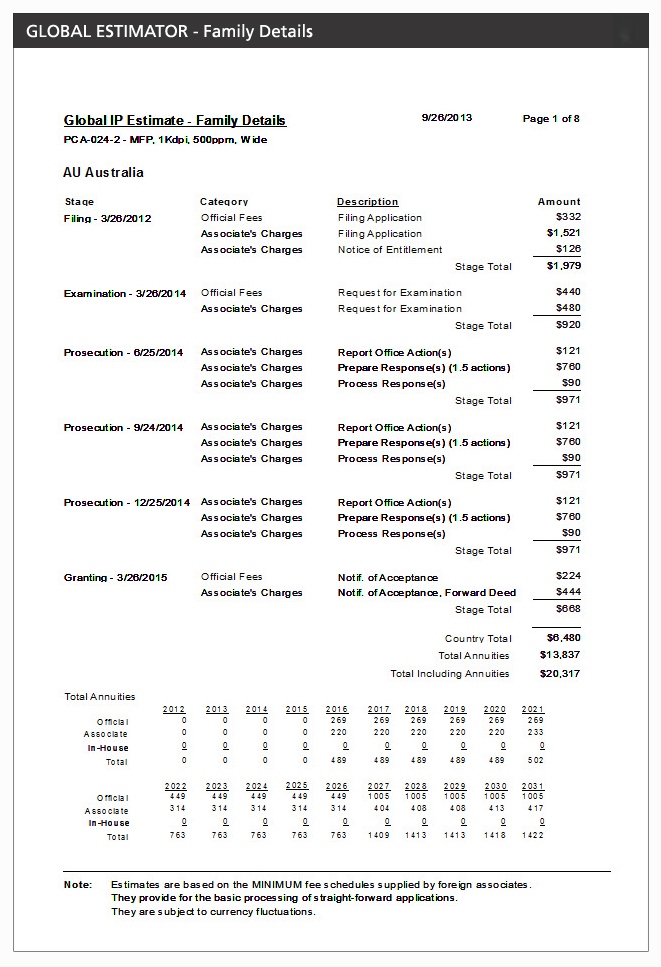
The following Analysis Report example displays the patent filing costs for a single patent family, by country.
Download these sample reports.
- Detailed
Family costs fully detailed by country
Hide

Download Sample Reports


 for assistance.

